Main Findings
Independent Cases
Collatz sequences can be broken down into eight independent cases or "letters" based on the last 5 bits of the initial number. Some of these letters cover multiple binary cases, reducing the total number of distinct scenarios needed to be considered.
Each letter is defined by the binary representation of the initial number and the resulting ups and downs pattern it generates. This pattern is determined by checking all numbers within a particular letter, ensuring they produce the same sequence of ups and downs.
Moreover, the final resulting numbers for each letter need to be homogeneously distributed, meaning that when considering the last 5 bits, all possible outcomes (32) appear and repeat equally often.
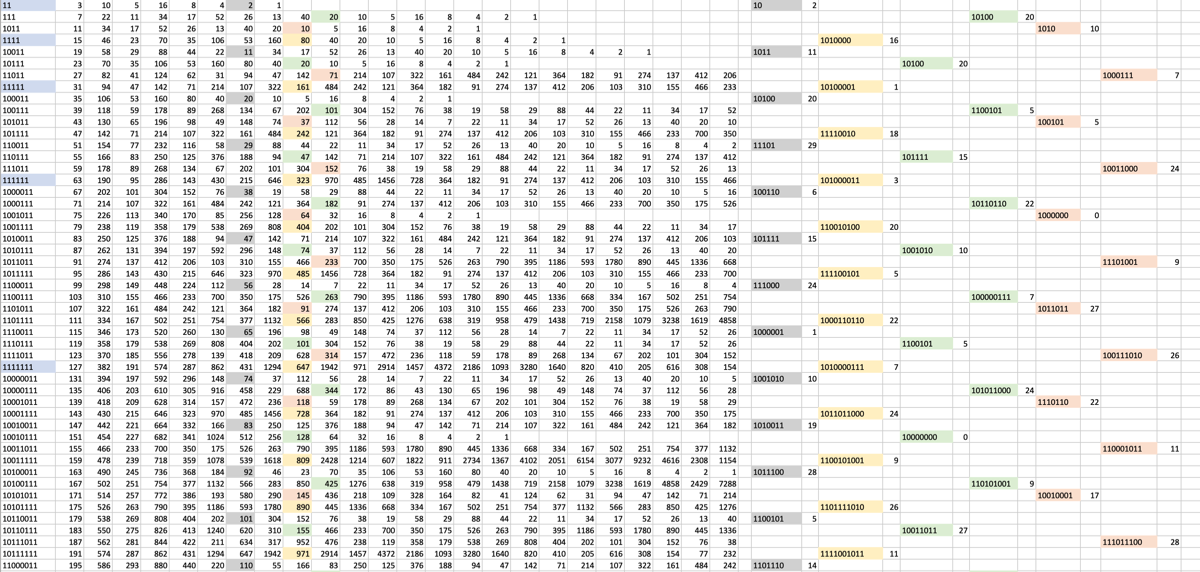
Image 1. Table used to corroborate the homogeneous distribution.
Eight Letters
Here's a breakdown of each letter:
Letter
A
B
C
D
E
F
G
H
Binary
XXXX0
XXX01
X0011
10111
01011
00111
11011
X1111
Ups-Downs
↓
↑↓↓
↑↓↑↓↓↓
↑↓↑↓↑↓↓↓
↑↓↑↓↓↑↓↓
↑↓↑↓↑↓↓↑↓
↑↓↑↓↓↑↓↑↓
↑↓↑↓↑↓↑↓
Occurrences
16/32
8/32
2/32
1/32
1/32
1/32
1/32
2/32
To better understand it, let's consider each letter individually.
Letter A: This letter encompasses all even numbers in binary format (ending in 0: 2, 4, 6, etc.). When applying the Ups-Downs pattern ↓, these numbers are divided by 2, resulting in a repeating sequence of 32 unique outcomes (00001, 00010, 000011, etc.). Notably, this process generates all possible cases in a homogeneous distribution, where every outcome is equally likely to occur.
Letter B: This letter corresponds to odd numbers in binary format ending in 01 (1, 5, 9, 13, etc.). The Collatz rules trigger sequences that start with the pattern ↑↓↓ to all of these numbers. For instance, the sequence for number 5 is 16, 8, 4, 2, 1, and number 9 generates a sequence like 28, 14, 7, 22, etc.
After applying the Ups-Downs pattern ↑↓↓ to 5 we obtain a result 4 on the third digit of the Collatz sequence. When examining the last 5 bits of this number, followed by analyzing subsequent sequences for numbers 9, 13, and so on, we find that their third digits also exhibit homogeneous distribution, meaning every possible outcome is equally likely to occur.
The key concept here is “homogeneous distribution”, which means that every possible outcome is equally likely to occur for each letter. This property is rigorously verified for all 8 letters, ensuring that they work consistently according to the Collatz rules.
Visual Confirmation
To further validate the Eight Letters hypothesis, a computer program was developed to plot sequences from any number. The goal was to confirm that every sequence can be expressed as a combination of these 8 letters.
The program visualized each sequence with eight distinct colors, making it easier to analyze and understand the underlying patterns (Images 2 and 3). This graphical approach revealed intricate details about the sequences, allowing for a more nuanced understanding of the Eight Letters.
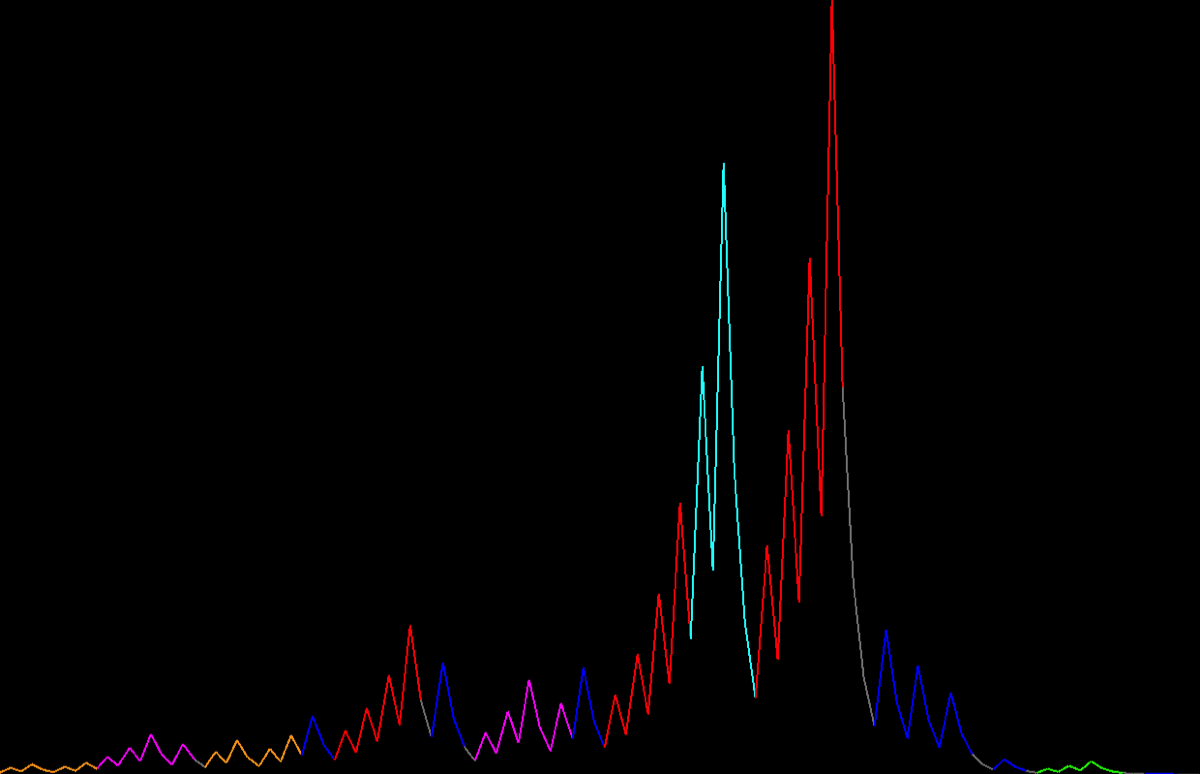
Image 2. Number 27 sequence plot.
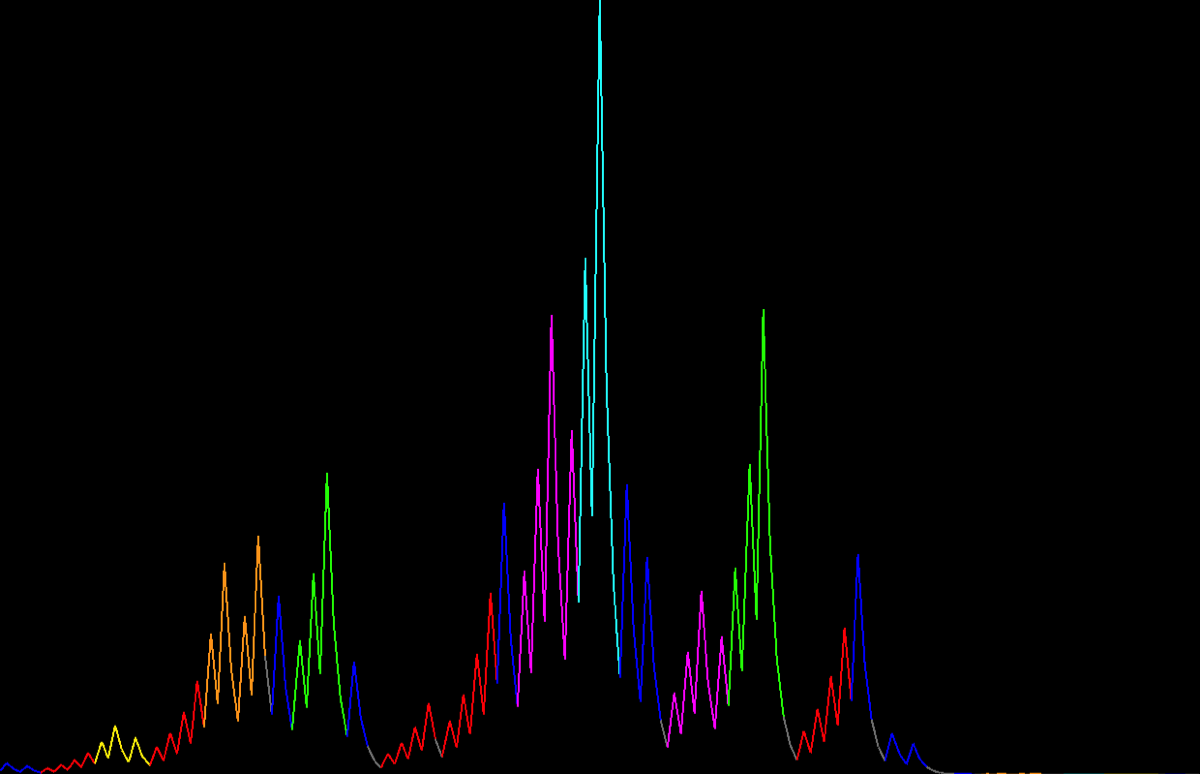
Image 3. Number 1249 sequence plot.
By pressing a key, the same letters from the original plot are converted into a straight line from the initial number to the final result (Images 4 and 5).

Image 4. Number 27 sequence plot simplified.
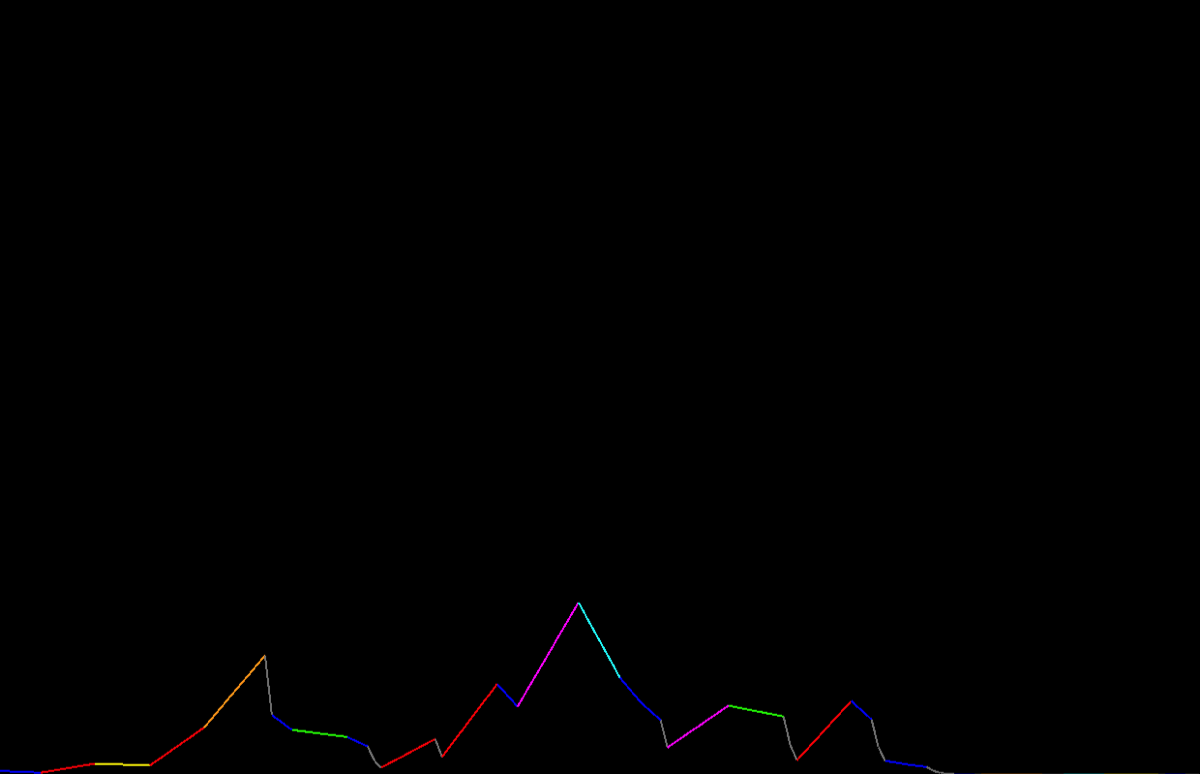
Image 5. Number 1249 sequence plot simplified.
These new plots follow the same underlying structure, colors and inter-letter values, but without the peaks they don't look as dramatic as the original ones.
The following table shows the calculations and colors for each letter, accounting for the +1 to keep accuracy.
Letter
A
B
C
D
E
F
G
H
Final Result
x / 2
(3x + 1) / 4
(9x +5) / 16
(27x +19) / 32
(27x + 23) / 32
(81x + 73) / 32
(81x + 85) / 32
(81x + 65) / 16
Color
Grey
Blue
Cyan
Green
Yellow
Magenta
Orange
Red
Finding an Order
Let's establish a consistent order for the sequences. First, we define the sequence of number zero as any amount of consecutive As. This assumption is based on the fact that zero is considered an even number and will be divided by two indefinitely. Similarly, we consider all sequences that reach number 1 to consist of any amount of consecutive Bs (after 1 is reached). The reason is that B represents the ending loop 1→4→2.
It's essential to note that the reading order of the digits is inverted, meaning that the least significant digit goes first instead of last.
Let's examine the first digit found in all sequences from 0 to 31: A B A C A B A F A B A E A B A H A B A C A B A E A B A G A B A H. If we were to use 32 independent letters, they would show up in this list in a similar way that the digits 0 through 9 appear in the base-10 numeric system.
This 32-letter pattern repeats infinitely, so any sequence will follow this first digit pattern. For instance, the sequence produced by the number 27 starts with a G. If we calculate any 32n + 27 sequence, they all start with a G as well.
The first digit repeats every (32^1) sequences. The second digit repeats every (32^2) sequences. The third digit repeats every (32^3). And this progression continues to infinity. The first N digits of any sequence repeat every 32^N interval.
To illustrate this concept, let's consider an example. This is the sequence of the number 27: GFAEEAAAACACAABEAGAAACEABAA, and we know that the first 3 digits GFA will appear on every sequence separated by 32^3 intervals from 27, that is 32768. Now, if we add 56 (any arbitrary number) times 32768 to 27, we get 1835035 which generates the following sequence: GFAGBAABACGAFBBABABDAAAABEABEAAABAABAAFAABAA. Both sequences start with GFA. Replacing the number 56 with any other value will still generate a sequence that starts with GFA.
Additionally, if we count the appearance of each letter in any block of 32^n consecutive numbers, starting from any random number, we'll get a match with the "Occurrences" column. For example, counting the first three letters from all sequences within a 32^3 = 32768 block, will give us a total of 98304 letters. And the distribution of each letter will match the following table.
Letter
A
B
C
D
E
F
G
H
Count
49152
24576
6144
3072
3072
3072
3072
6144
Ocurrences
0.5000 = 16 / 32
0.25000 = 8 / 32
0.06250 = 2 / 32
0.03125 = 1 / 32
0.03125 = 1 / 32
0.03125 = 1 / 32
0.03125 = 1 / 32
0.06250 = 2 / 32
Period
2
4
16
32
32
32
32
16
This distribution is exactly the same when starting the block from any initial number.
In general, for any sequence of length M, it will repeat itself every 32^M numbers.
To illustrate this concept, consider the sequence generated by 27, which has 30 letters: GFAGBHABAFBHCHAAABBBAABADAABAA. This same initial 30-letter sequence repeats as the initial 30 letters of the much longer sequence (32^30) + 27, as shown:
GFAGBHABAFBHCHAAABBBAABADAABAABBBBBBBBBBBBBBBBBBBBBBBBBBBBBBBBBBBBBBBBAA
BBAACAAABDBABBDACAABGAAHAAHAAAABAAAAEAADAAABABAAABACACABAAHFAFABBABAAAAA
AAABACHAAHABCAAAAAAGAHCAFBAAAABCDAAADABEAABBBAAGABBADAABAABCFCHAAABBABG
AAABAABHBCCAAECBCAAAAAADBECHBCBHAHAABBBAABAAHGAAAAAAAHBAAABEBBFAAABBAAAB
BABBAABBABAABAAAFAGBHABAFBHCHAAABBBAABADAABAA.
And actually, the sequence repeats earlier as follows.
For any sequence, the initial N letters repeat every P = P1 * P2 * ... * PN, where PX is the period of the letter at position X.
To determine how often a sequence repeats itself, start from the first letter and multiply its period by each subsequent letter's period. So the sequence generated by 27 will repeat itself after a lower number than 32^30. Which is exactly 1180591620717411303424 + 27.
For instance, sequences starting with "FG" are found at numbers 743, 1767, 2791, 3815, 4839, etc., which all repeat every 1024 (32 * 32) numbers, corresponding to the product of their individual periods. Specifically, F and G have periods of 32 each.
Similarly, sequences beginning with "GFH" are found at numbers 9243, 25627, 42011, 58395, 74779, etc., which all repeat every 16384 (or 32 * 32 * 16) numbers. This is equivalent to the product of their individual periods: G (32), F (32), and H (16).
Therefore, if there exists any Collatz sequence that never reaches the 4-2-1 loop, there would not just be one, but an infinite number of such sequences.
A visualization tool (Image 6) has been developed to aid in understanding Collatz sequences. Each colored square corresponds to a letter. A sequence is a vertical stack, which starts at the bottom, and consecutive sequences are drawn from left to right, being able to navigate to any number and see all adjacent sequences.
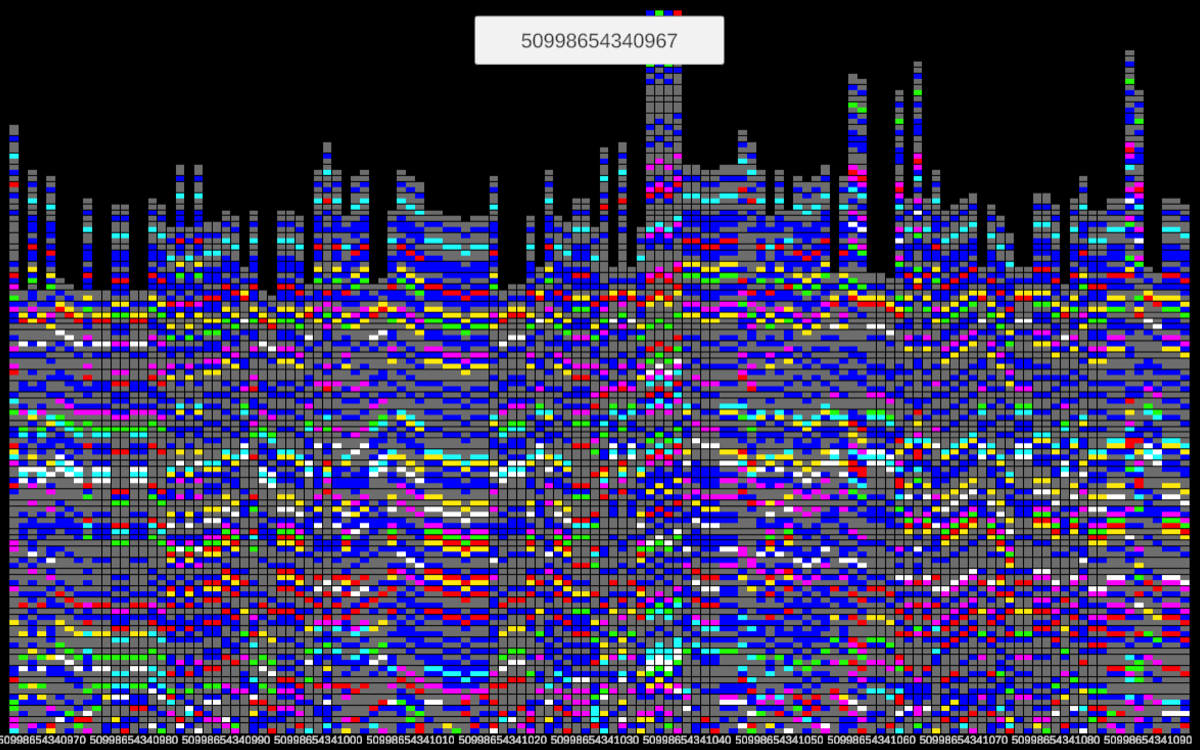
Image 6. Grid Tool
While we have a good grasp of the horizontal behavior, further research is needed to comprehend the vertical patterns of these graphs.
Consecutive Sequences Analysis
When examining different sequences in the visualization (Grid) tool and analyzing how they change as the seed number varies, the following observations can be made:
For a block of N consecutive sequences, the lengths exhibit a minimum and a maximum. The length distribution resembles a combination of overlapping normal curves (multimodal distribution), with lengths concentrating around a few distinct values.
If a block of sequences contains a 2^N number, the smallest 2^N will produce the shortest sequence. Numbers with binary representations ending in several consecutive 0s also generate shorter sequences because they are predominantly composed of the letters A. The remaining sequences form groups with similar subsequences, resulting in a multimodal distribution. We will explore why this grouping occurs in detail.
We analyzed the final N letters of consecutive sequences and identified a recurring phenomenon. For instance, within sequences 1 to 10,000, there are only 59 unique 10-letter endings. A similar result is observed when examining sequences 10,001 to 20,000, with the same 59 endings appearing but in a different order. However, when analyzing sequences between 1,000,000 and 1,010,000, the number of unique endings decreases to just 35. This pattern becomes even more pronounced as the range increases: between 1,000,000,000 and 1,000,010,000, only 13 unique endings remain.
To recover all 59 endings in the first example, the range must be extended significantly—for instance, from 1,000,000 to 2,000,000. This suggests that certain endings repeat more frequently within smaller ranges, but as the numbers grow larger, the frequency of repetition decreases. In fact, when performing the same analysis on blocks of 10,000 consecutive sequences at extremely large numbers, the repetitions eventually diminish to just one. Image 10 illustrates the endings of 50 consecutive sequences at a significantly large number.
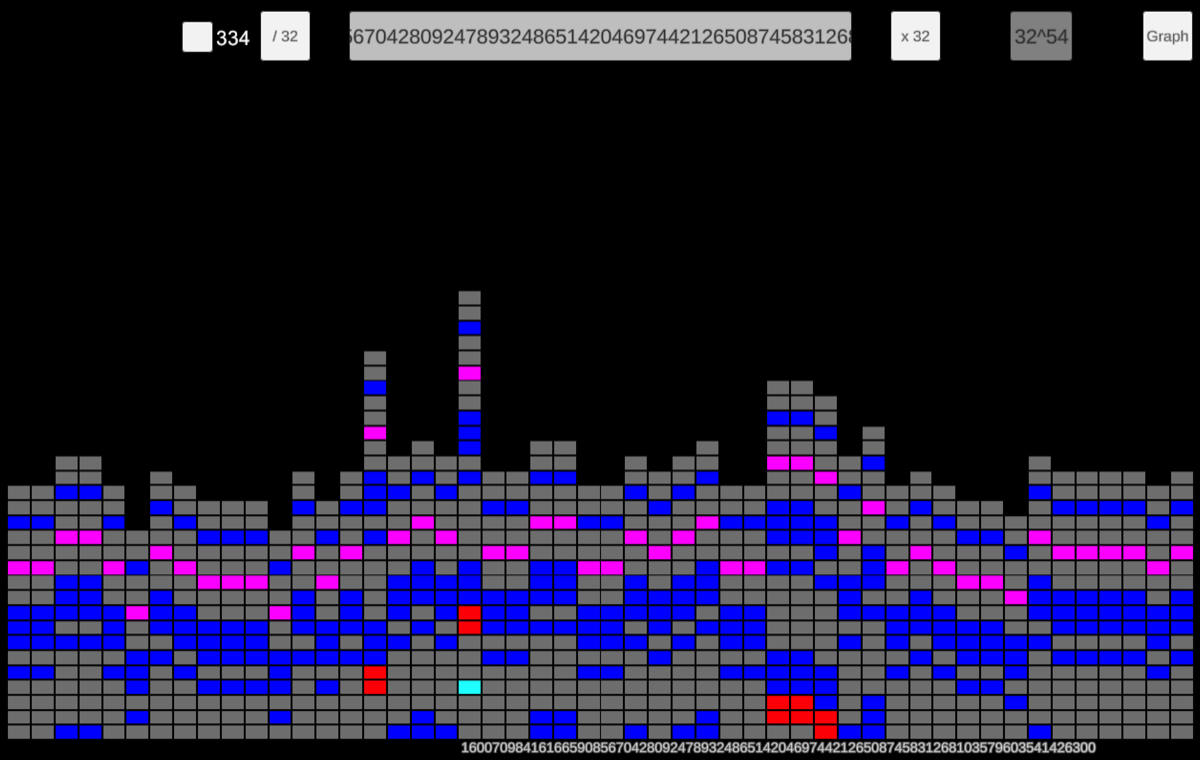
Image 7. Endings of very large consecutive sequences.
A phenomenon called "convergence effect" explains why certain consecutive sequences reach the same number after a few steps, eventually producing identical subsequences. For example:
164
82
41
124
165
496
248
124
To explain it mathematically, consider the binary representation of an even number ending in 100. Its third value can be calculated as: (3(Y/4)) + 1 = 0.75Y + 1. The subsequent odd number ending in 101 has its third value calculated as (3X+1)/4 = 0.75X + 0.25. Both calculations yield the same result, causing these sequences to merge. And this happens to all 100’s and the next 101’s. This convergence effect extends to larger blocks of consecutive sequences, for example:
3684
1842
921
2764
1382
691
2074
3685
11056
5528
2764
1382
691
2074
3686
1843
5530
2765
8296
4148
2074
1048418
524209
1572628
786314
393157
1179472
589736
294868
147434
73717
221152
1048419
3145258
1572629
4717888
2358944
1179472
589736
294868
147434
73717
221152
1048420
524210
262105
786316
393158
196579
589738
294869
884608
442304
221152
1048421
3145264
1572632
786316
393158
196579
589738
294869
884608
442304
221152
1048422
524211
1572634
786317
2358952
1179476
589738
294869
884608
442304
221152
Consider the sequence of 27 which starts as 27, 82, 41, 124, 62, 31. The number 31 = (2^5) -1 is part of the sequence, and from this value both sequences share the same 106 values long sub-sequence (in numbers). In letters, both sequences are 30 letters long. 27-sequence touches a total of 111 different values, 76 of which fall between 32 and 1024, plus those numbers that reach any of these within their sequences (for example all doubles of values lower than 512), plus all those consecutive sequences with bleeding effect. There is a total of 418 sequences that end with the same long subsequence between 32 and 1024. This accounts for nearly half of all sequences in this range.
Outstanding Sequences
Certain sequences stand out due to their lengths being noticeably greater than those preceding them, such as the 27-sequence. When analyzing consecutive sequences using the grid tool, we observe that some sequences are significantly longer or shorter than others, with spikes in both directions. Positive spikes (indicating length increase) are categorized as outstanding sequences.
An algorithm was developed to identify outstanding sequences within a range of consecutive numbers. Two parameters were fine-tuned to ensure a balanced output: capturing enough spiking sequences while minimizing the inclusion of less outstanding ones. The goal was to identify all potential outstanding sequences without missing any.
Outstanding sequences were then filtered from blocks of one million consecutive sequences, starting from various numbers. The findings were intriguing: the number of outstanding sequences in each block remained remarkably consistent, typically fluctuating between 50 and 60. For instance, the first block (sequences from 1 to 1 million) contained 48 outstanding sequences. This block also exhibited the greatest variability in sequence lengths, ranging from 30 to 135, as it spans numbers from 32^0 to nearly 32^4. The first three outstanding sequences identified were:
Sequence 27 with 30 letters, Sequence 26623 with 89 letters, and Sequence 47329 with 91 letters. Interestingly, sequence 47329 shares its last 50 letters with sequence 26623, suggesting it may be a variation rather than a wholly unique sequence. Nevertheless, it is included and counted as outstanding.
In sequences from 1M to 2M, the lengths of outstanding sequences range between 104 and 143. A regression line drawn across this range indicates a slight increase in length as the sequence numbers grow larger. For very large sequences in the order of 10^20, the lengths range between 247 and 303, but with no significant upward trend, resulting in a relatively flat regression line.
At large scales, one million sequences is not a significant sample and no conclusion can be drawn. Nevertheless, it would be impractical and time-consuming to identify all outstanding sequences for a very large block of numbers. Instead, samples of one million consecutive sequences were taken at different magnitudes (e.g., starting from 1, 1M, 10M, 100M, 1B, 10^18 and 10^36), and a graph (Image 14) was plotted to visualize the findings.
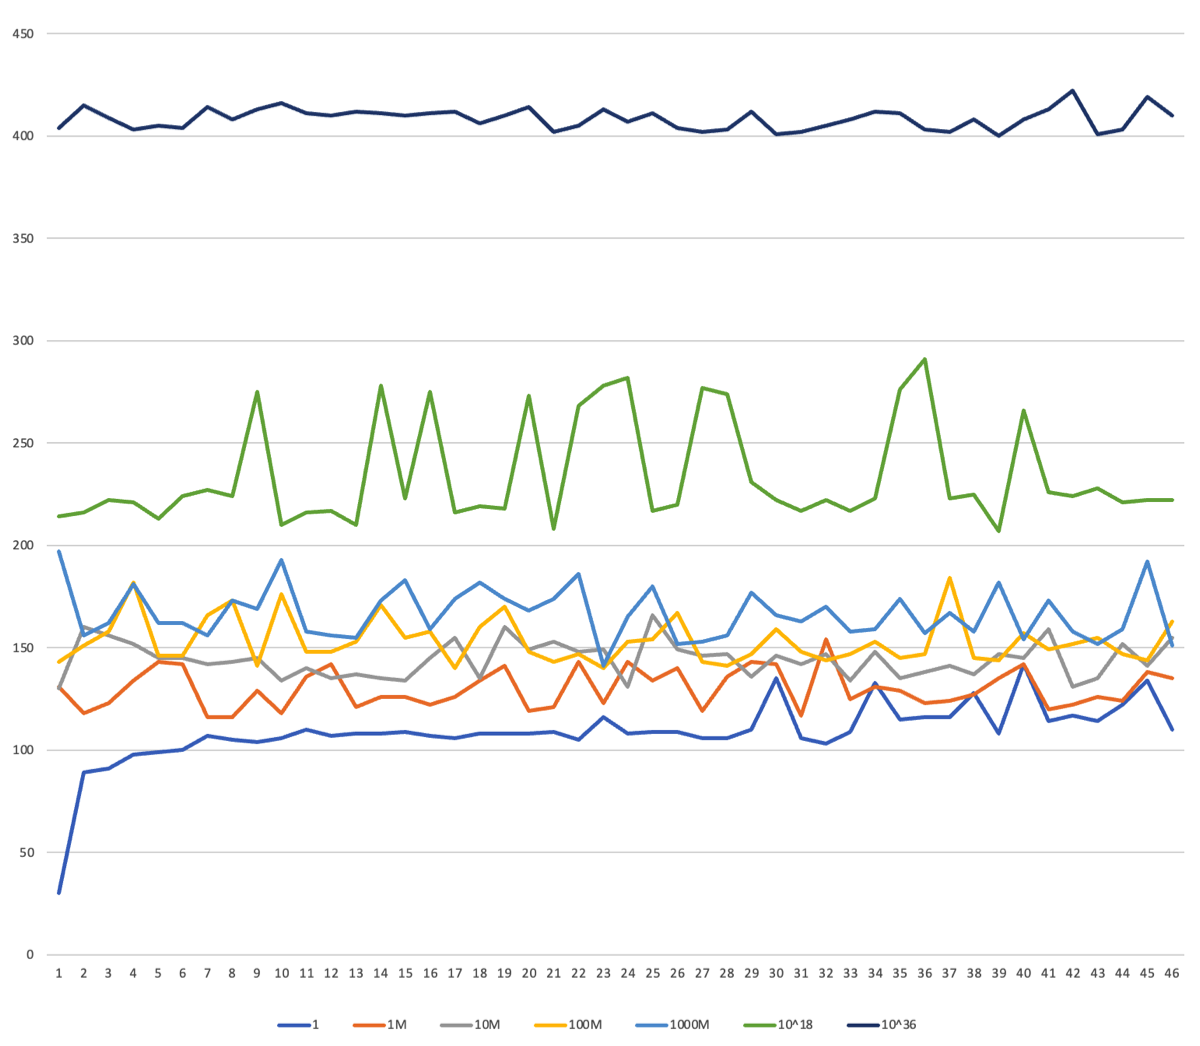
Image 8. Outstanding sequences length
The distribution of outstanding sequences within a single block is not uniform. Some sequences slightly deviate above or below their expected values but can still be considered linearly distributed. To standardize the analysis, the lower-length sequences were eliminated until only 48 remained in each block.
The lengths of outstanding sequences appear to fall within a predictable range, rather than being random. Upon further analysis, two types of extreme sequences emerged to explain the variability. Initially, it was hypothesized that the length of a sequence was solely related to the highest value reached. The same algorithm returned the highest value reached by each outstanding sequence and how many times it was larger than N. For instance:
Sequence 10435454 (153 letters) reaches a value 126377 times higher than its starting value. However, the subsequent outstanding sequence, 10456057 (124 letters), reaches a value only 38 times higher. These observations suggest a more complex relationship between sequence length and the magnitude of the higher value reached.
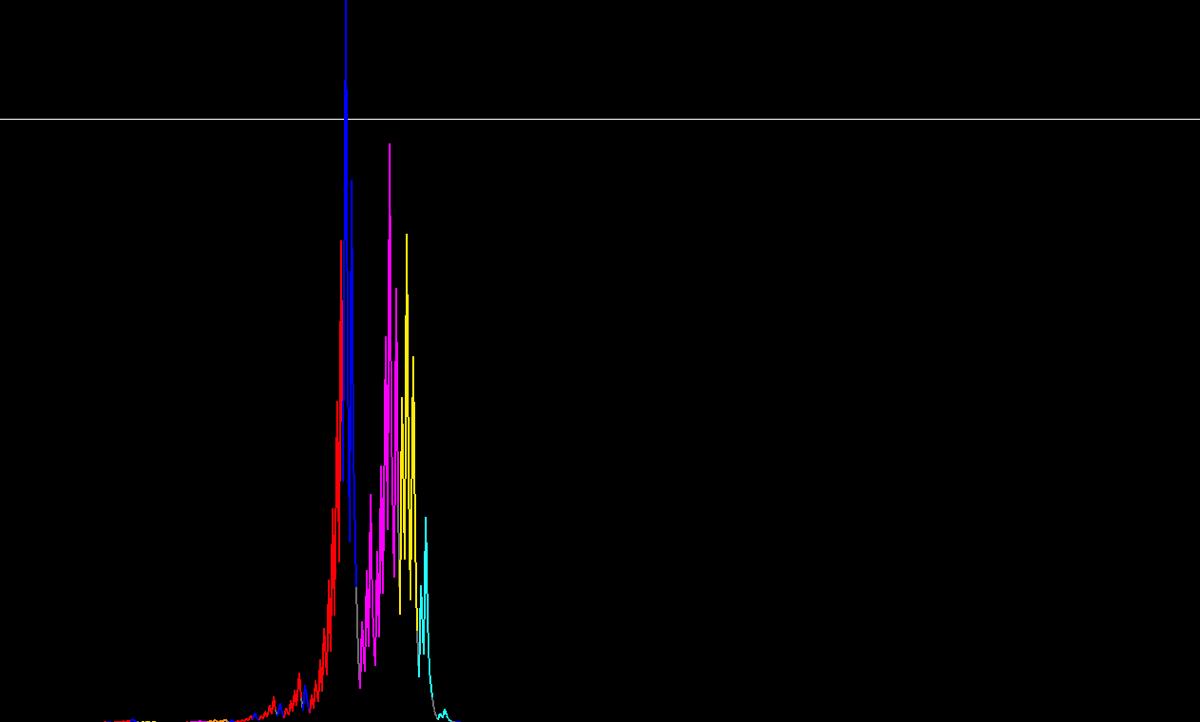
Image 9. Sequence 10435454
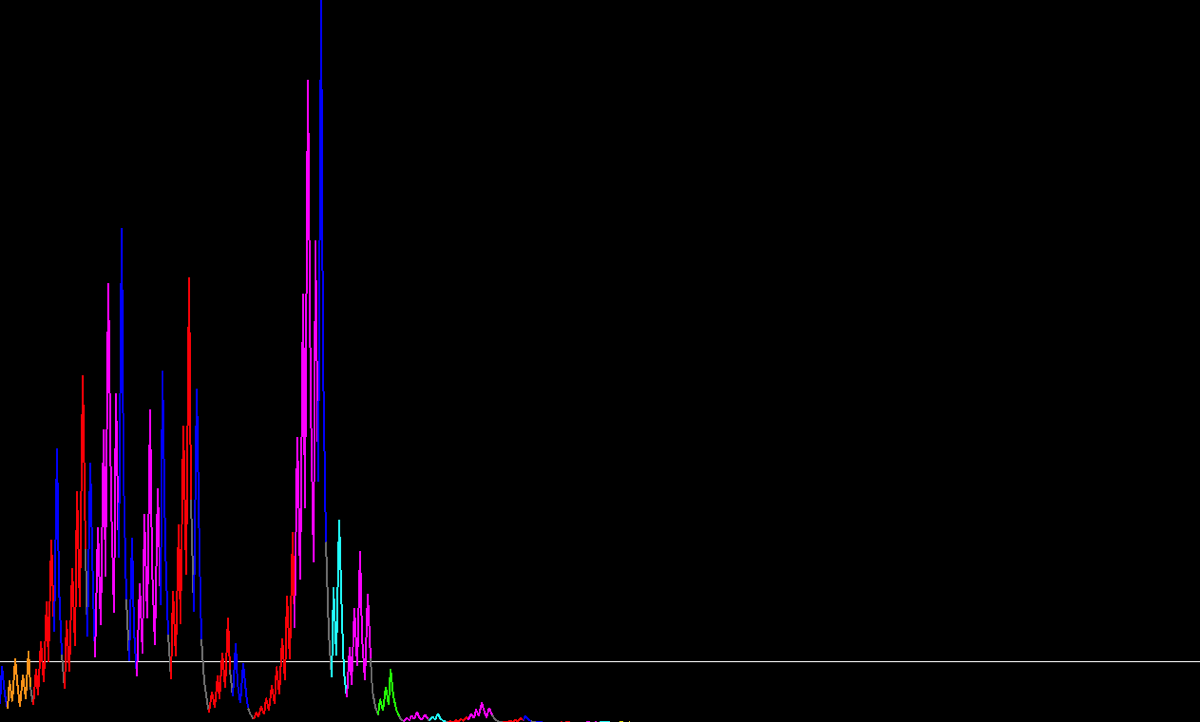
Image 10. Sequence 10456057
When outstanding sequences are plotted, very high peaks overshadow other parts of the graphic with smaller peaks which are not visible. Sequences reaching exceptionally high values tend to lack additional significant rises within the same order of magnitude. Conversely, sequences with lower peaks often exhibit multiple visible rises. In both cases, the total number of letters remains constrained within a specific range determined by the order of magnitude of N.
This is why an additional checkbox was added to the tool for graphing a single sequence differently. When checked, the vertical scale switches to logarithmic, allowing all peaks to be visible without being overshadowed by larger ones.
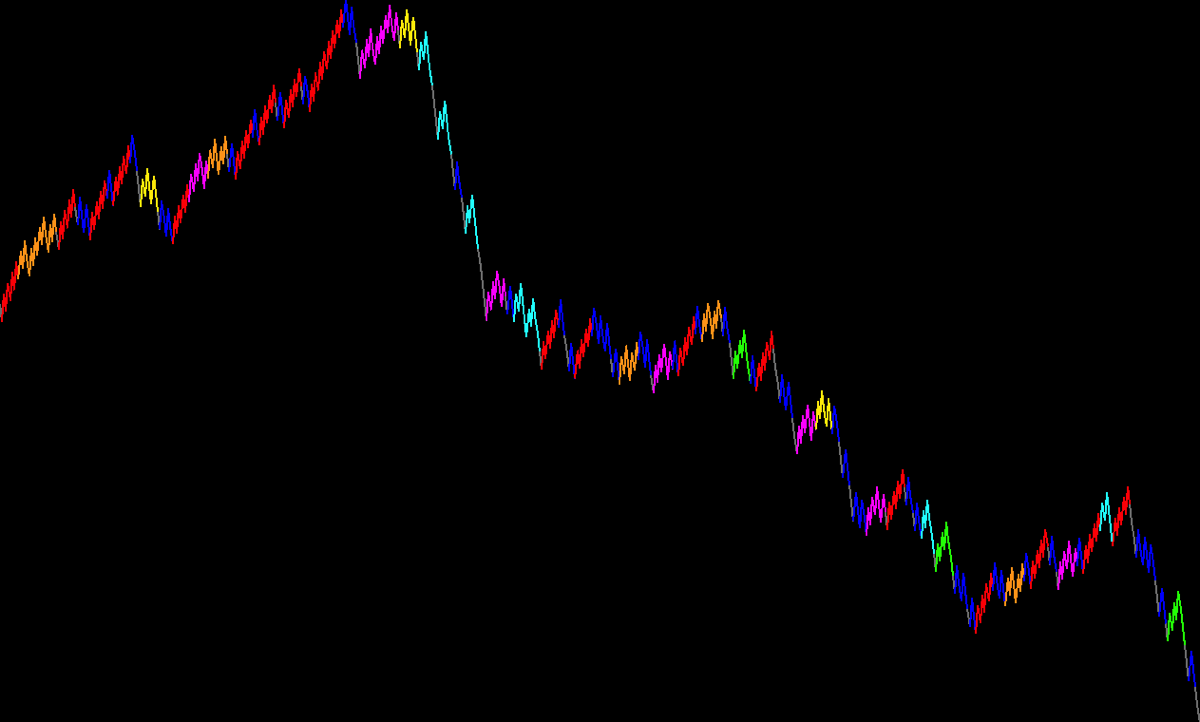
Image 11. Sequence 10435454
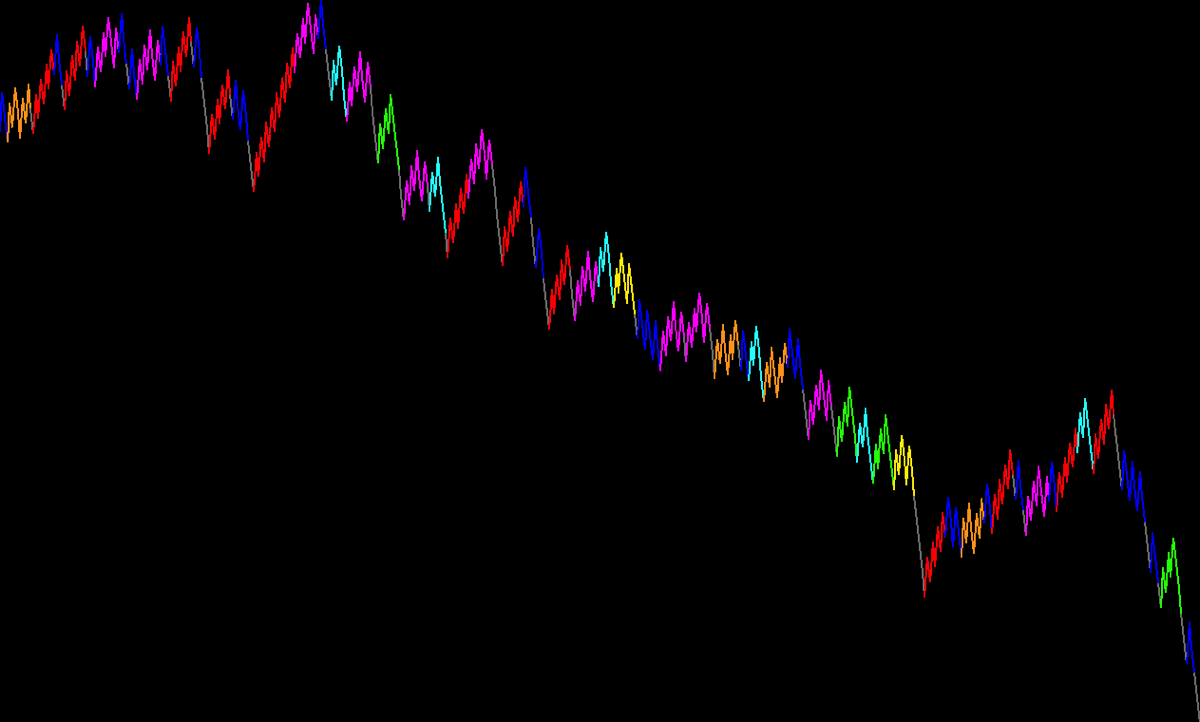
Image 12. Sequence 10456057
Extreme Sequences
In consecutive sequences arranged in ascending order, an extreme sequence is defined as the first occurrence of a sequence longer than any previously identified. The length of each sequence is determined by the number of letters it contains. A comprehensive search from 1 to 30,000,000,000 identified a total of 51 extreme sequences:
Number: 27, Length: 30
Number: 55, Length: 31
Number: 147, Length: 32
Number: 171, Length: 35
Number: 231, Length: 36
Number: 327, Length: 41
Number: 655, Length: 43
Number: 703, Length: 45
Number: 871, Length: 50
Number: 1695, Length: 51
Number: 1743, Length: 52
Number: 2463, Length: 53
Number: 2919, Length: 56
Number: 3711, Length: 66
Number: 6171, Length: 67
Number: 7423, Length: 68
Number: 10971, Length: 70
Number: 13255, Length: 73
Number: 15039, Length: 75
Number: 22559, Length: 76
Number: 26623, Length: 89
Number: 52527, Length: 98
Number: 105055, Length: 99
Number: 142587, Length: 107
Number: 263103, Length: 110
Number: 467739, Length: 112
Number: 511935, Length: 116
Number: 626331, Length: 135
Number: 837799, Length: 142
Number: 1564063, Length: 143
Number: 1675599, Length: 144
Number: 1723519, Length: 154
Number: 3447039, Length: 156
Number: 6649279, Length: 162
Number: 8400511, Length: 181
Number: 15733191, Length: 186
Number: 31466383, Length: 188
Number: 36791535, Length: 197
Number: 63728127, Length: 238
Number: 191184383, Length: 239
Number: 268549803, Length: 241
Number: 537099607, Length: 242
Number: 670617279, Length: 248
Number: 1005925919, Length: 249
Number: 1412987847, Length: 252
Number: 1674652263, Length: 253
Number: 2610744987, Length: 261
Number: 4578853915, Length: 273
Number: 4890328815, Length: 289
Number: 12212032815, Length: 292
Number: 13371194527, Length: 308
Extreme sequences tend to be less frequent when the seed values are higher, but at the same time they tend to increase in length higher than the rest of sequences around, making the last extreme sequences from the list to really stand out from the rest of the surrounding sequences.
Note that these sequences differ from the 'record-breaking' sequences calculated step by step, instead of multi-step letters. Additionally, to accelerate coverage across more numbers, extreme sequences are only calculated for numbers whose binary representation ends in '11'.
When using a different method, such as including all numbers, the list of extreme sequences obtained varies slightly. This difference arises due to a convergence effect, where one number replaces another that it converges with. In fact, most of the final sequences converge into 95,592,191, which has a length of 238 letters. There are likely more sequences that follow this pattern, but they do not appear in this particular list.
The key takeaway is that these extreme sequence lists may not be identical. However, the maximum height reached within a limited range (relative to the order of magnitude) remains remarkably similar. Additionally, by calculating the average length of 2,000 sequences surrounding each extreme sequence, we can measure how much each extreme sequence deviates from its neighbors.
The following graph visualizes both the length of extreme sequences and the average surrounding length on the same logarithmic x-axis, revealing an insightful pattern. Both plots show a linear increase, with the extreme sequence length plot (blue) being slightly steeper than the average length plot (orange).
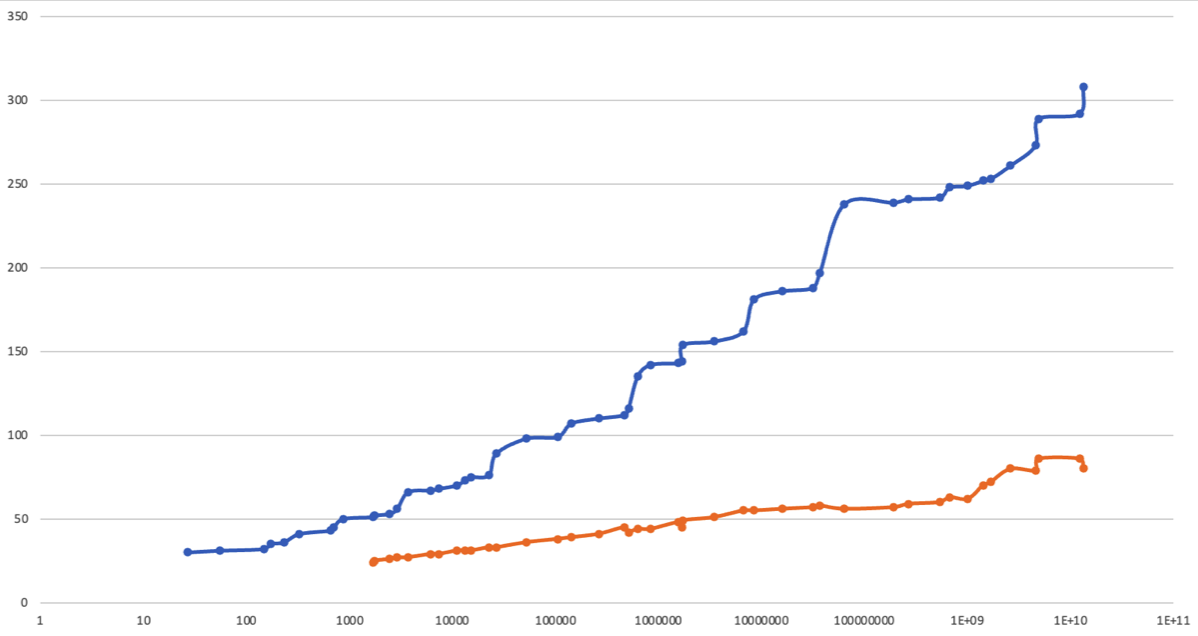
Image 13. Length of extreme sequences and average length of surrounding sequences
If relationships hold for very large numbers, then extending the blue line will define the approximate length of any extreme sequence.

Image 14. 900 sequences around an extreme sequence at 63728127
Panoramic Viewer
Each of the following images represents ten thousand consecutive sequences, starting from different values. Scroll left or right to explore them all.

Image 15. From 1 to 10000

Image 16. From 10^6 to 1010000

Image 17. From 10^9 to 1000010000

Image 18. From 10^12 to 1000000010000

Image 19. From 10^15 to 1000000000010000

Image 20. From 10^18 to 1000000000000010000

Image 21. From 10^21 to 1000000000000000010000

Image 22. From 10^24 to 1000000000000000000010000

Image 23. From 10^27 to 1000000000000000000000010000
Examining the images, even though they display only a small portion of the sequences, we can make the following observations:
- All the images feature a solid band of colors at the bottom and a variable band at the top.
- The height of the solid band generally increases as the initial number increases.
- The relationship between the heights of these bands varies across all the images, and it even fluctuates within some individual images.
- There are long stretches of consecutive sequences that share similar color patterns, particularly after a few dozen jumps. This is clearer to see if the sequences are inverted, please check the next image and compare it with the previous one.

Image 24. From 10^27 to 1000000000000000000000010000 inverted.
One could say that the most significant letters appear at the bottom. In reality, they illustrate the path sequences take to reach 1, revealing that multiple consecutive sequences follow the same trajectory. This final path consistently shifts at 32^n, especially when n is large. See the following image, centered at 32^90, for reference.
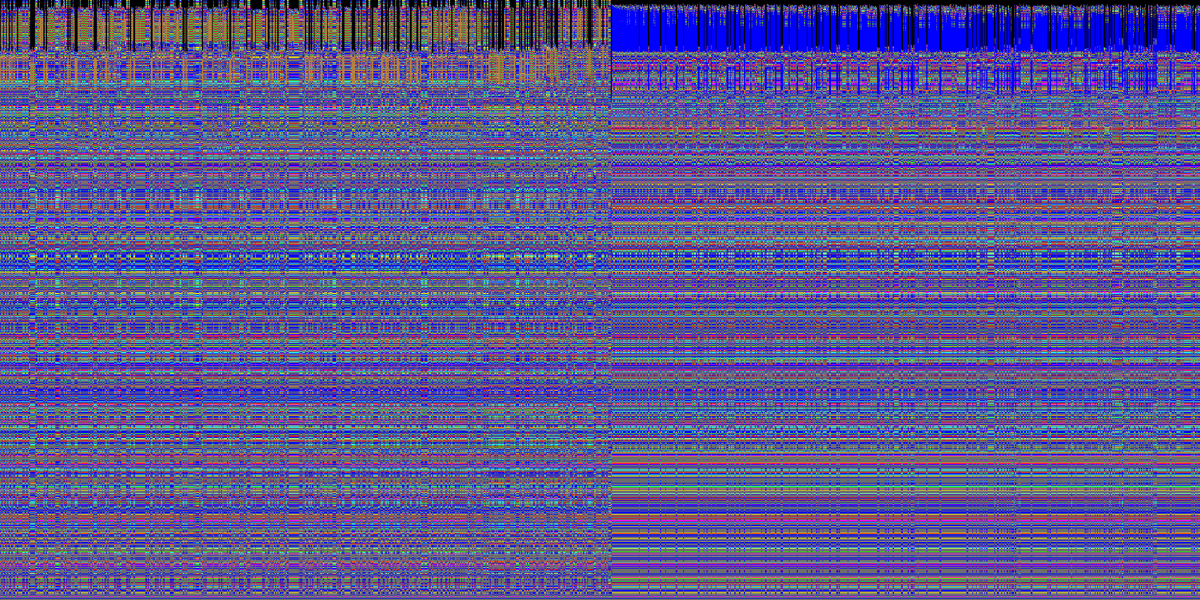
Image 25. 2000 sequences around 32^90, inverted.
The following images, both centered at 32^200, present intriguing details about Collatz sequences, one in its regular form and the other inverted.

Image 26. 1000 sequences around 32^200

Image 27. 1000 sequences around 32^200. Inverted
© baKno LLC. All rights reserved. Contact