Tool Manual
Graph
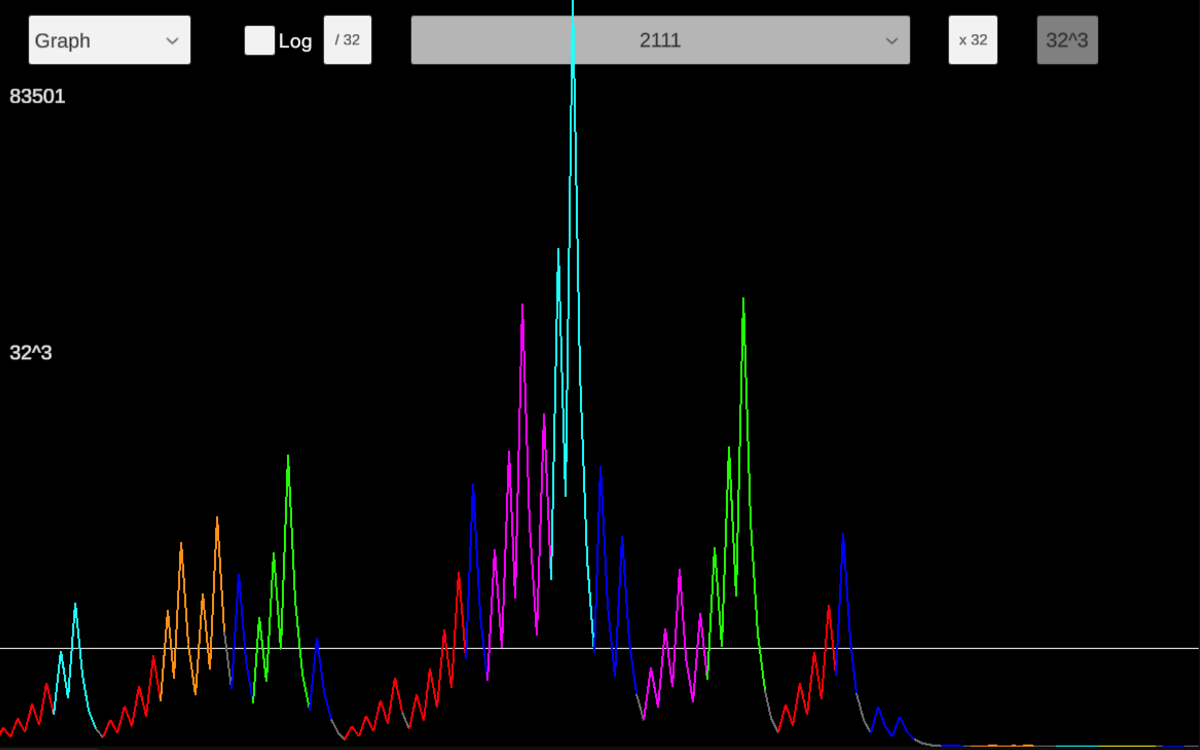
The Graph section displays the Collatz sequence for a single number. You can input the number directly in the input field, or use the Left and Right arrow keys to adjust the number. Holding the Shift key while pressing the arrow keys allows for discrete control.
The graph consists of colored lines, each representing a specific letter as described in the Main Findings or summarized on Image 4 below. Pressing the Down arrow will simplify the graph, turning each colored segment into a straight line. To return to the original graph, simply press the Up arrow.
You can zoom in or out on any part of the graph by using the scroll wheel on your mouse, and click-and-drag to navigate around the graph. On the left side, you'll see two numbers: the top one represents the largest value reached by the sequence, while the middle one indicates the value of the white horizontal line, which marks the highest 32^N value crossed, giving a sense of the sequence's order of magnitude.
Hovering your cursor over a line will update the top number, showing the value at that specific point. On the left side of the input field, there’s a toggle button that switches the vertical axis scale between linear and logarithmic (as explained in the Main Findings). On the right side of the input field, there is an arrow that toggles the visibility of a second line, which displays the actual sequence in letters, for reference if you want to check it.

Image 1. Graph section.
Grid
The Grid section displays a 50 x 50 grid of 50 consecutive sequences, with each cell representing a sequence letter. The controls are similar to those in the Graph section, but here we’ll explain the two buttons next to the input field: one divides the sequence by 32, and the other multiplies by 32, allowing you to easily navigate to higher numbers.
You can input a number directly in the input field, or use the directional arrow keys to navigate. With discrete movements of 20 numbers horizontally and 10 letters vertically, or horizontal scrolling with the Shift key. Or click-and-drag to navigate around the grid.
There’s a toggle button to the left of the input field that inverts the sequences, placing the last letters at the bottom. And an order-of-magnitude indicator is located to the right.
At the bottom of the grid, you’ll see the initial number for some sequences. Hovering over a cell will show the number reached by that letter. Additionally, the last cell of each sequence will display the sequence’s length.

Image 2. Grid section.
Binary
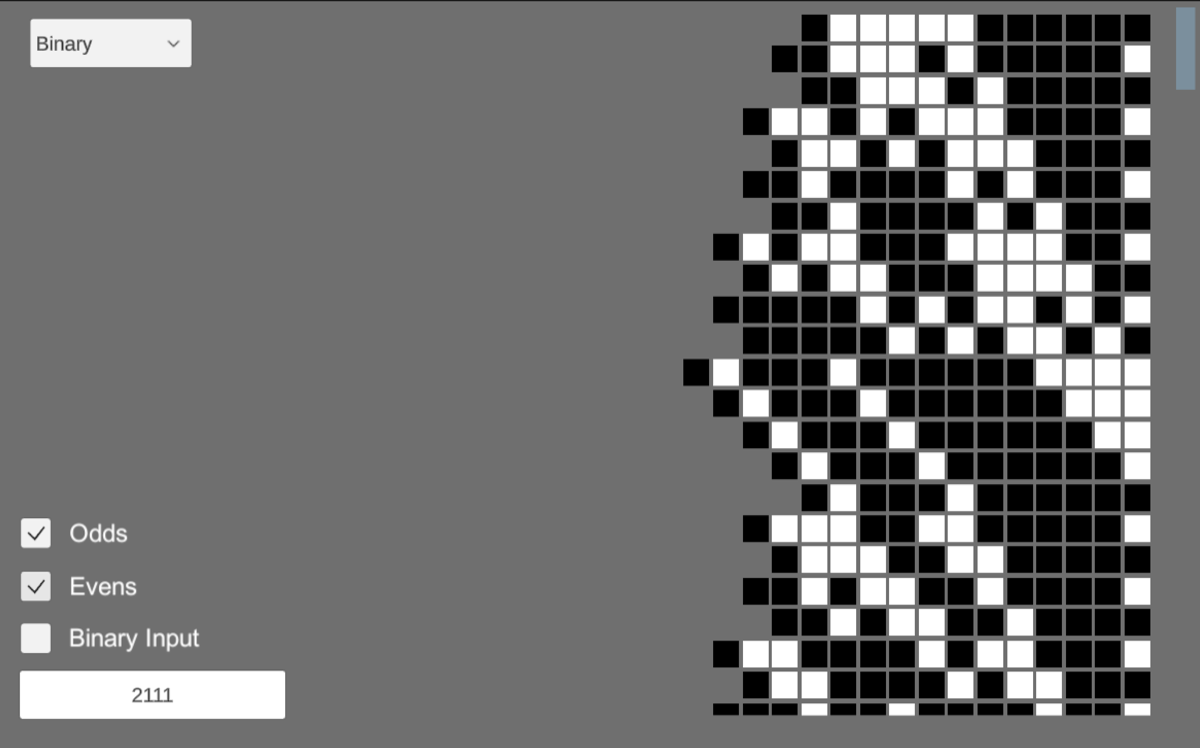
The Binary section presents the sequence as a vertically stacked series of binary numbers, right-aligned. This represents the numeric sequence (as explained in the Alternate Findings). The input field is located in the bottom-left corner, along with three toggles described below.
Binary Input Toggle – Allows you to enter a number as a binary sequence of 0s and 1s.
Evens Toggle – Shows or hides all even numbers in the sequence, which appear as horizontal rows ending in a white cell on the right.
Odds Toggle – Shows or hides all odd numbers in the sequence, which appear as horizontal rows ending in a black cell on the right.

Image 3. Binary section.
Export
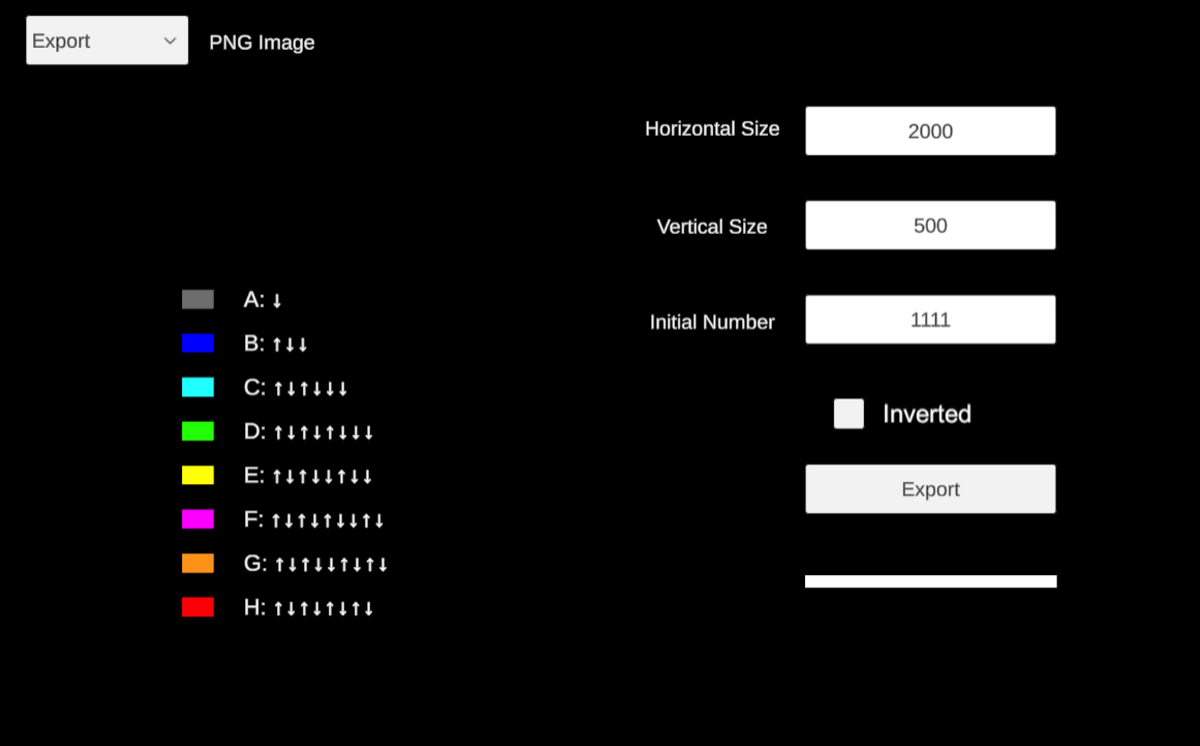
The Export section generates and saves a PNG image of an expanded portion of the Grid, where each pixel represents a cell or a letter in a sequence. These images are used in the Main Findings to provide a broader view of the Grid.
The controls are self explanatory, and there’s an option to invert the sequences. Additionally, the space on the left displays the sequence of jumps represented by each letter, along with its corresponding color.
The web version of the tool cannot export an image.

Image 4. Export section.
© baKno LLC. All rights reserved. Contact